Confirmed Cases (DRC + Uganda) - INSP MVE-101, 09-21
7,911
7,890 DRC · 20 + 1 prob. Uganda · 1 France
CDC: DRC 09-27 · Uganda 09-27 · France 06-24 · INRB 09-21
Source: INSP MVE-101 via INRB-UMIE (09-21)
Breakdown: 7,890 DRC · 20 Uganda (total: 7,911)
Cross-border: 20 confirmed + 1 probable in Uganda — 6 of 11 travel-linked to DRC (WHO DON605)
Confidence: moderate
Breakdown: 7,890 DRC · 20 Uganda (total: 7,911)
Cross-border: 20 confirmed + 1 probable in Uganda — 6 of 11 travel-linked to DRC (WHO DON605)
Confidence: moderate
Confirmed Deaths (DRC + Uganda) - INSP MVE-101, 09-21
3,801
3,799 DRC (48.1%) · 2 Uganda (10.0%)
Death proportion range 47-49% · Low confidence
Source: INSP MVE-101 via INRB-UMIE (09-21)
DRC death proportion: 3799/7890 = 48.1% · Uganda: 2/20 = 10.0%
Not a final death rate — right-censoring, unreported deaths, reporting delay. Bundibugyo historical death proportion ~32.8% (pooled estimate).
DRC death proportion: 3799/7890 = 48.1% · Uganda: 2/20 = 10.0%
Not a final death rate — right-censoring, unreported deaths, reporting delay. Bundibugyo historical death proportion ~32.8% (pooled estimate).
How this is measured
DRC death proportion = confirmed DRC deaths / confirmed DRC cases. Uganda separately. Wilson CI range reflects sampling uncertainty only — true uncertainty substantially larger due to active outbreak, delayed reporting, and case ascertainment gaps.Suspected Cases - INRB-UMIE MVE-101, 09-21
0
INRB-UMIE MVE-101 (09-21). Down from ~1,077 peak (26 May).
Reclassification ongoing · Low confidence
Source: INRB-UMIE SitRep MVE-018 (06-02) — primary DRC operational source
Trajectory: Peak ~1,077 (26 May) → 906 (27 May) → 349 (28 May) → 289 (01 Jun) → 206 (02 Jun)
Reclassification: Ongoing — cases ruled out after investigation are removed. Figure will continue to change.
CDC cleaned dataset (06-03): 116 (after continued revision)
Trajectory: Peak ~1,077 (26 May) → 906 (27 May) → 349 (28 May) → 289 (01 Jun) → 206 (02 Jun)
Reclassification: Ongoing — cases ruled out after investigation are removed. Figure will continue to change.
CDC cleaned dataset (06-03): 116 (after continued revision)
Contacts Listed — Africa CDC Sitrep #85, August 10 2026
17,693
16,862 DRC · 831 Uganda · 14,782 under follow-up
Coverage 83.5% Meets WHO target
Source: Africa CDC Sitrep #85, August 10 2026
Contacts listed: 16,862 DRC + 831 Uganda (total: 17,693)
Under follow-up: 14,782 (83.5% coverage)
WHO target: >80% follow-up coverage — met
Confidence: moderate (Africa CDC official sitrep)
Contacts listed: 16,862 DRC + 831 Uganda (total: 17,693)
Under follow-up: 14,782 (83.5% coverage)
WHO target: >80% follow-up coverage — met
Confidence: moderate (Africa CDC official sitrep)
Health Zones with confirmed cases - Africa CDC Sitrep #24
64
Zones with >=1 confirmed case (INRB-UMIE zone-level data)
+20 Uganda confirmed + 1 probable (cross-border)
Source: Africa CDC Sitrep #24, June 10 2026 (DRC: 27 zones, Uganda: 1 zone; 28 combined). INRB-UMIE zone-level count: 27 DRC zones. WHO DON605 (27 May): 13 zones (different criteria). Confidence: moderate
Highest Attack Rate - INSP/INRB-UMIE, 05-28 (DRC-only)
657.5
per 100,000 in Mongbalu (n=1,037) · Low confidence
Nizi: 591.4/100k
Source: INSP SitRep + WorldPop population estimates, 28 May (DRC only)
Cases per 100,000 population (confirmed + suspected). Range reflects statistical uncertainty only — population estimates in conflict zones carry additional uncertainty from displacement.
Confidence: low
Cases per 100,000 population (confirmed + suspected). Range reflects statistical uncertainty only — population estimates in conflict zones carry additional uncertainty from displacement.
Confidence: low
Outbreak Phase (notification data, 7-day)
▲ Growth
+515 confirmed (+7%) over 8d (09-13→09-21). Notification-date only — may include diagnostic backlog.
Notification-date only. Linelist not available. Low confidence
Epidemic phase: Notification data through 09-21 (INRB-UMIE) and CDC totals through 09-27 indicate continued growth with geographic expansion (3 DRC provinces + Uganda). Confirmed cases rose from 7258 (09-13) to 7773 (09-21): +515 in 8 days, driven in part by diagnostic backlog clearance. The most recent 7 days of notification data are provisional and should not be interpreted as a trend. An onset-based assessment of epidemic phase is not possible (individual linelist not accessible). Low confidence
Primary source: INSP SitRep via INRB-UMIE (MVE-101, 09-21). DRC: 7,890 confirmed, 3799 deaths. Suspected: 0 (reclassification ongoing — down from ~1,077 peak on 26 May). Uganda: 20 confirmed + 1 probable, 2 death. Verification: CDC (09-27) confirms 7,911 total confirmed, 3801 deaths. CDC cleaned suspected figure: 116. All sources labelled throughout.
Death proportion (DRC): 3799 of 7,890 DRC confirmed cases have died (48.1%, range 47-49%). Uganda: 2 of 20 (10.0%). Not a final death rate \u2014 many cases are still unresolved and some deaths go uncounted. Bundibugyo has historically killed about 1 in 3. INRB-UMIE reports 220+ suspected deaths in addition to confirmed. Low confidence
Not shown (data not available): Reproduction number, final death rate, onset-based curves, test positivity, contact follow-up rates, secondary attack rate, and demographics (age/sex). These need individual case records we don't have access to; showing them would be guesswork.
Data through 09-21 (INRB-UMIE) · CDC 09-27 · official sources WARNING: 57d since last update — verify primary sources before use All figures labelled with date and source. Epi curves show notification date (not onset). Recent days are shaded provisional on the plots \u2014 counts routinely rise on later reports.
Geographic Distribution
Map precision: Health zone centroid level. Click markers for cases, deaths, attack rates, PCR capacity. Source: INSP SitRep, WorldPop, INRB-UMIE.
Decision Layer: What Requires Immediate Action
- No BDBV-specific countermeasures. Vaccine candidates under evaluation (WHO expert consultation 2026-05-28). rVSV-ZEBOV cross-protection unestablished.
- Diagnostic gap. Standard Ebola RDTs do not detect BDBV. PCR available at INRB Kinshasa and Bunia field lab only.
- Active conflict zone. Armed groups limit access to multiple health zones in Ituri and Nord-Kivu.
- Genomic sequences not yet in local analysis. 16 Pathoplexus genomes available; pipeline update required.
- Cross-border coordination gaps. DRC-Uganda joint surveillance active but incomplete at informal border crossings.
Risk Assessment (WHO/ECDC)
| Level | Rating | Source |
|---|---|---|
| National (DRC) | Very High | WHO DON605 |
| Regional (Africa) | High | WHO DON605 |
| Global | Moderate | WHO DON605 |
| EU/EEA | Low-Moderate | ECDC TAB |
Key risk factors: No approved countermeasures, confirmed cross-border transmission, conflict zone, high population mobility, low diagnostic capacity.
Linelist data not available. All analysis derived from aggregate WHO/ECDC situation reports. Individual case records require access from DRC Ministry of Health.
Epidemic Curve - National (Confirmed + Suspected)
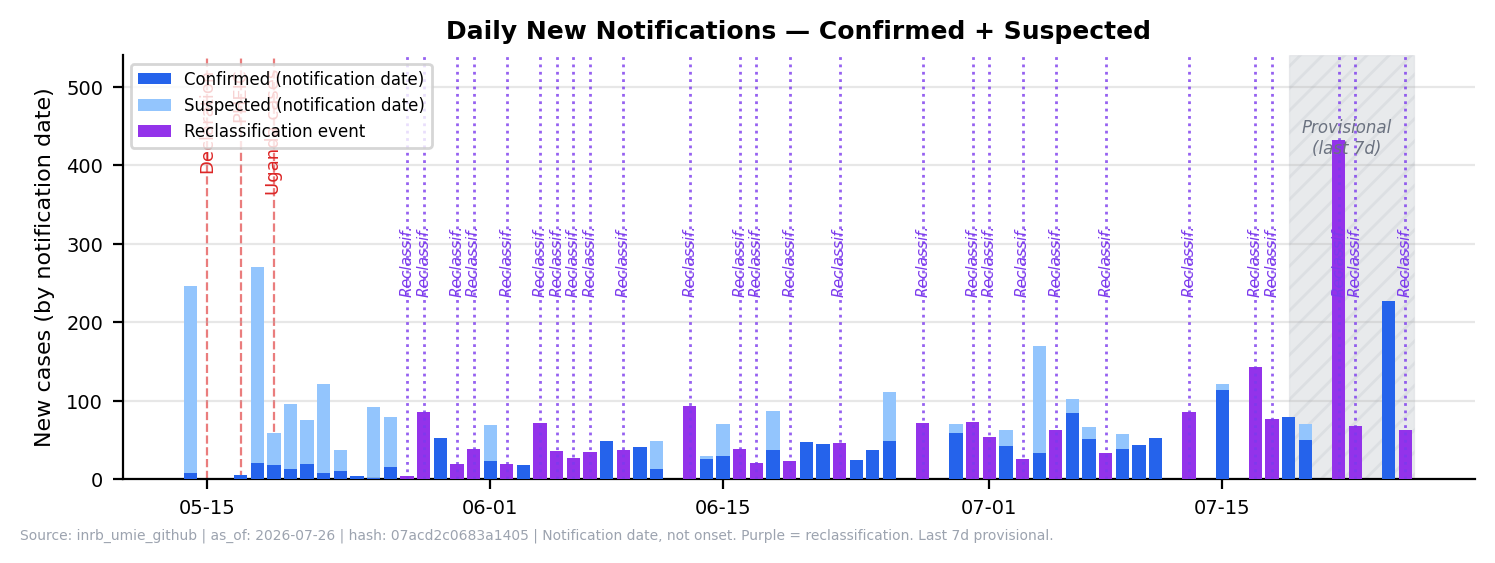
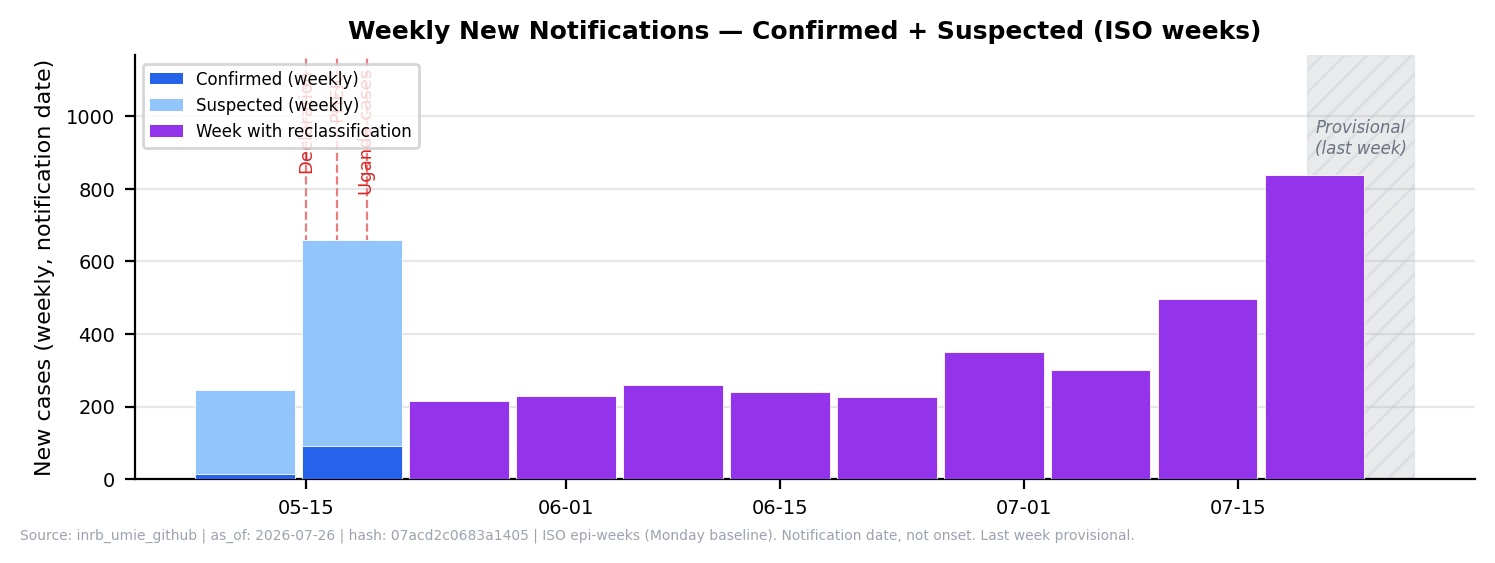
Notification date, not onset. Dashed red = Declaration/PHEIC/Uganda. Purple bars = reclassification events (batch suspected→confirmed, not new infections; suspected dropped by 557 on 05-28). Source: INSP SitRep via INRB-UMIE.
Confirmed Cases by Health Zone
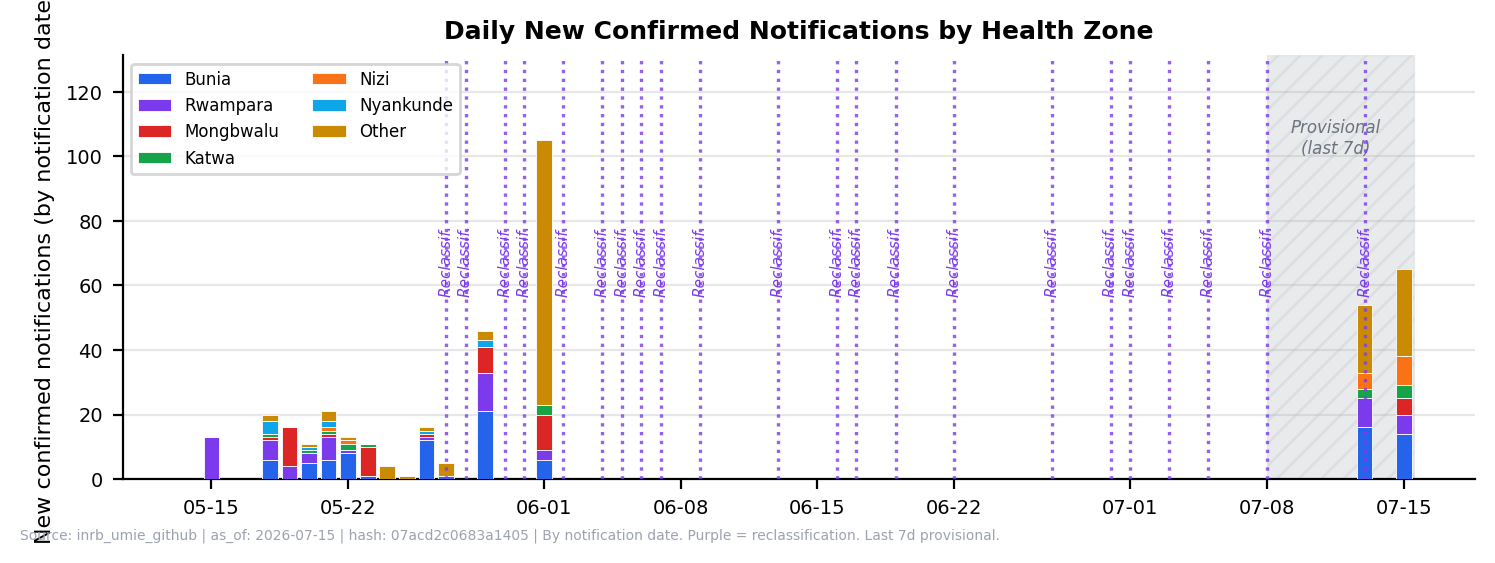
Top 6 zones stacked. Bunia, Rwampara, and Mongbalu account for 82% of confirmed. Source: INSP SitRep. Not updated since 2026-06-01 (per-zone daily data not published by INRB-UMIE since SitRep 18).
Cumulative Trajectory
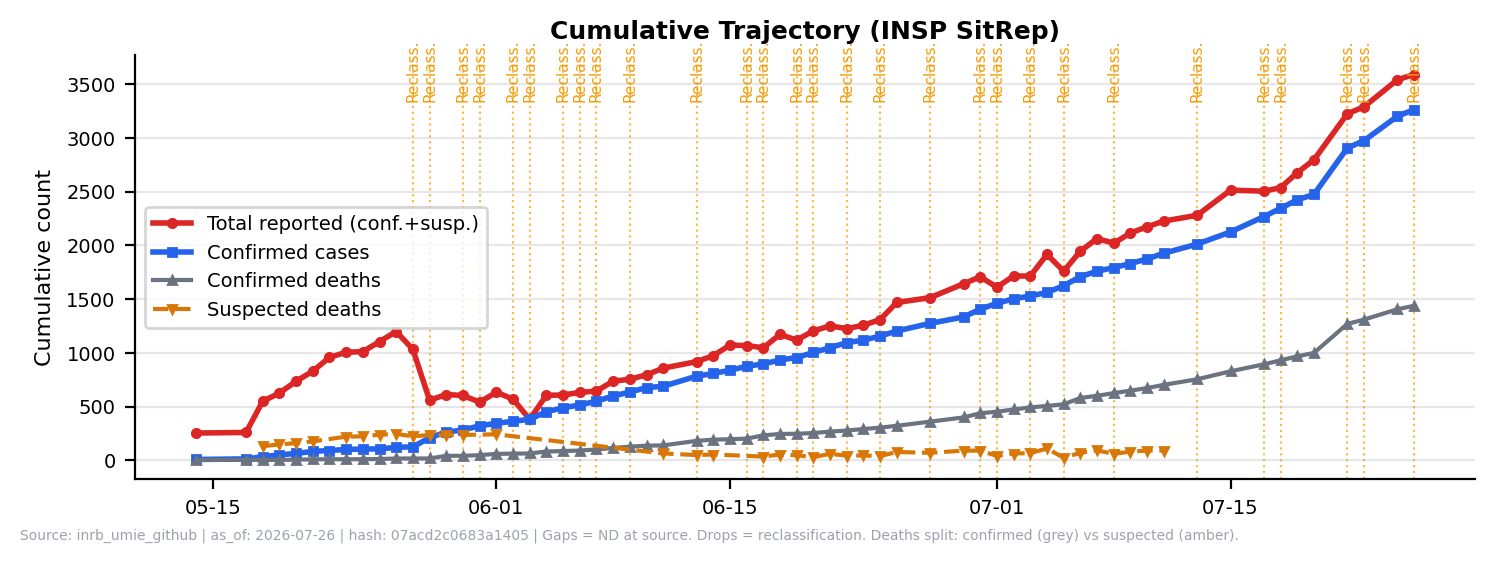
Drops reflect reclassification or case removal. Deaths split: confirmed (grey solid) + suspected (amber dashed). Gaps = not reported (ND). Source: INSP SitRep via INRB-UMIE.
Operational Linelist Schema (WHO Outbreak Toolkit standard)
| Category | Required Fields | Data Status |
|---|---|---|
| Identification | Case ID, household ID, cluster ID, reporting facility | Not available |
| Demographics | Age, sex, pregnancy, occupation, vulnerable status | Not available |
| Location | Residence, GPS/admin unit, health area, camp/block | Health zone level only |
| Time | Onset, notification, consultation, sample, lab result, isolation | Aggregate weekly |
| Clinical | Symptoms, severity, hospitalisation, outcome | Not available |
| Classification | Suspected / probable / confirmed / discarded | Available (2 classes) |
| Epidemiology | Exposure, travel, event, water source, contact to case | Not available |
| Laboratory | Test type, result, Ct, viral load, sequence ID | Partial (PCR only) |
| Response | Isolation, treatment, contact listing, vaccination | Not available |
| Data Quality | Missing values, inconsistencies, duplicate suspect | Cannot assess |
Case Classification Summary
| Region | Confirmed | Suspected (DRC MoH) | Confirmed Deaths | Source |
|---|---|---|---|---|
| Ituri (DRC) | -- | -- | -- | CDC 09-27 (province split pending) |
| Nord-Kivu (DRC) | -- | -- | -- | CDC 09-27 |
| Sud-Kivu (DRC) | -- | -- | -- | CDC 09-27 |
| DRC total | 7,890 | 0 | 3,799 | INRB-UMIE MVE-101 (09-21) · CDC 09-27 verification |
| Uganda | 20 + 1 probable | 0 | 2 + 1 probable | CDC 09-27 · WHO DON605 |
| France (imported) | 1 | 0 | 0 | WHO DON606 · French MoH 06-24 — HCW returning from DRC; very low viral load, stable |
| Total confirmed | 7,911 | 0 | 3,801 |
Confirmed: CDC (09-27): 7,890 DRC + 20 Uganda (7,911 total). Province breakdown from INRB-UMIE zone data (09-21): Ituri 5575, Nord-Kivu 1194, Sud-Kivu 0 confirmed; 1021 unattributed to zones. Suspected: 0 per INRB-UMIE (09-21).
Daily New Confirmed Cases by Health Zone (interactive)
Daily New Confirmed Notifications - DRC (INSP SitRep, INRB-UMIE)
This is a notification curve, not an epidemiological incidence curve. Bars show net daily change in confirmed cases by reporting date, not symptom onset date. Purple bars (05-28, 05-31) are reclassification events — bulk re-labelling of existing suspected cases as confirmed after laboratory review. On 05-28, 557 suspected cases were reclassified simultaneously; the 85-case bar does not represent 85 new infections. True onset-based incidence requires linelist data (not available).
Loading...
New confirmed (reporting date)
Reclassification event (not new infections)
Source: INSP SitRep via INRB-UMIE. Zone-level daily breakdown available through SitReps 001-012 (05-14 to 05-27) only — not stored in structured data for later dates.
Daily Notification Curve - Confirmed + Suspected, DRC (INSP SitRep)
Notification curve, not an epidemiological incidence curve. Bars show new cases by reporting date, not symptom onset. From 05-28 onward, suspected counts drop sharply to near zero — this reflects mass reclassification of the suspected pool (557 cases reclassified on 05-28 alone), not a true collapse in transmission. Purple bars mark reclassification events. True onset-based incidence requires linelist data (not available).
Loading...
Confirmed
Suspected
Reclassification event
View data table
| Date | New Conf. | New Susp. | Total | Note |
|---|---|---|---|---|
| Loading... | ||||
Notification date, not onset date. INSP SitRep via INRB-UMIE. Gaps (05-15/16, 05-17) are non-reporting days. Suspected counts can decrease due to reclassification — the net figure is shown; negative values are displayed as 0.
Intervention Timeline
2026-04-24Index case onset (HCW, Bunia)
2026-05-15DRC MoH declares outbreak
2026-05-17WHO declares PHEIC
2026-05-18First 3 genomes on Pathoplexus
2026-05-19First Uganda cases (Kampala)
2026-05-20+6 Pathoplexus genomes
2026-05-22WHO DG Member State briefing
2026-05-28+5 Pathoplexus genomes
2026-05-28WHO expert consultation: therapeutics & vaccines
2026-05-31CDC: 291 confirmed — mass reclassification
2026-06-01CDC: 332 confirmed, 116 suspected
2026-06-24France: 1st confirmed case outside Africa (HCW, WHO DON606)
2026-09-27CDC: 7,911 confirmed (7890 DRC + 20 UG), 3801 confirmed deaths. Suspected: 0 (INRB-UMIE 09-21).
Estimated Delays (aggregate-derived, wide uncertainty)
These are rough aggregate estimates, not measured from individual cases. Wide uncertainty: derived from patterns in INSP SitRep reporting dates, not from a linelist with onset and notification dates per case. Actual delays vary substantially by health zone, security situation, and diagnostic access. Conflict-affected zones likely have much longer delays. Do not use these estimates for epidemiological modelling without individual-level data. Low confidence
placeholder
Cases by Health Zone with Attack Rates (INSP SitRep, DRC only, 05-28)
| Health Zone | Confirmed | Suspected | Total | Population | Attack Rate /100k | Adj. AR /100k (IDP) | Deprivation (CCVI) |
|---|---|---|---|---|---|---|---|
| Bunia | 1666 | 268 | 1934 | 509,060 | 379.9 | 358.1 | 0.82 |
| Rwampara | 1056 | 241 | 1297 | 252,324 | 514.0 | 513.4 | 0.83 |
| Mongbalu | 691 | 346 | 1037 | 157,714 | 657.5 | ~657.5 | -- |
| Nizi | 761 | 6 | 767 | 129,697 | 591.4 | 563.2 | 0.81 |
| Katwa | 544 | 13 | 557 | 612,242 | 91.0 | ~91.0 | 0.81 |
| Mangala | 341 | 0 | 341 | 89,713 | 380.1 | 345.3 | 0.83 |
| Beni | 289 | 0 | 289 | 428,854 | 67.4 | ~67.4 | 0.81 |
| Lita | 276 | 0 | 276 | 113,364 | 243.5 | 203.1 | 0.81 |
| Nia Nia | 269 | 0 | 269 | 91,756 | 293.2 | 291.6 | 0.86 |
| Butembo | 253 | 7 | 260 | 289,378 | 89.8 | ~89.8 | 0.81 |
| Bambu | 196 | 14 | 210 | 136,151 | 154.2 | 154.2 | 0.83 |
| Nyakunde | 127 | 52 | 179 | 94,004 | 190.4 | ~190.4 | -- |
| Komanda | 147 | 0 | 147 | 219,948 | 66.8 | 63.7 | 0.86 |
| + 52 additional zones with fewer cases | |||||||
Source: INSP SitRep MVE-101 via INRB-UMIE (09-21), DRC only. 64 zones after alias merge. Population: WorldPop. Attack rates use confirmed + suspected total cases (INRB-UMIE zone denominator). CDC (09-27) shows 7,890 DRC confirmed. Mongbalu has highest AR (657.5/100k).
Adj. AR uses WorldPop baseline + IDP inflow (UNHCR/OCHA static matrix, Ituri-centred). 23 of 64 zones have IDP displacement data. Zones without IDP data shown as ~baseline. Displacement denominator carries high uncertainty in conflict settings. Low confidence
Deprivation index (CCVI): 0=low deprivation, 1=high. 62 of 64 zones have CCVI data. High scores (≥0.80, red) throughout Ituri reflect pre-existing socioeconomic vulnerability and amplified outbreak risk. Source: CCVI socioeconomic deprivation composite (UNHCR/World Bank proxies). Contextual only — do not use for case attribution
Affected Health Zones
| Province | Health Zones | Status |
|---|---|---|
| Ituri | Bunia, Rwampara, Mongbalu, Nyakunde, Hoho, Lumumba | Active |
| Nord-Kivu | Butembo, Mabalako, Katwa (Goma status under verification) | Active |
| Sud-Kivu | Bukavu | Limited |
| Uganda | Kampala district | Import-linked |
Cross-Border Risk
- Bunia-Bundibugyo corridor: ~30 km to Uganda border. Primary trade route, multiple informal crossings.
- Lake Albert crossings: Unmonitored informal border points. Fishing communities cross daily.
- Kampala link: 6 of 11 early Uganda confirmed cases travel-linked to DRC (WHO DON605). 350 km from border zone.
- Goma-Gisenyi: High-traffic DRC-Rwanda border crossing. Enhanced surveillance active.
Maps: All interactive maps are available on the Situation tab (A). Scroll to the map section after the key metrics.
Demographic data not available from aggregate reports. Age/sex/occupation breakdown requires linelist access from DRC Ministry of Health. The information below reflects what is known from WHO and press reporting.
Known Demographic Factors
- Healthcare workers: 158 HCW cases (3.5% of confirmed) — 46 HCW deaths. Index case was HCW in Bunia.
- Children under 5: Cases reported in young children (count not published).
- Pregnant women: Status unknown - not reported in available sources.
- IDPs/refugees: Ituri hosts significant displaced populations. Displacement camps may facilitate transmission.
- Age/sex distribution: Not published. Required for targeted response planning.
Priority Demographic Data Needs
| Variable | Why Needed | Status |
|---|---|---|
| Age groups (5-year bands) | Age-specific attack rates, vaccination targeting | Missing |
| Sex | Gender-specific risk, care-seeking patterns | Missing |
| Occupation | HCW risk, market vendors, burial workers | Partial |
| Pregnancy status | Maternal/neonatal risk, treatment decisions | Missing |
| IDP/refugee status | Vulnerability, population denominator | Missing |
| Exposure history | Transmission chains, risk stratification | Missing |
Death Proportion Trend vs. Historical BDBV
| Date | Confirmed | Confirmed Deaths | Death Proportion |
|---|---|---|---|
| 05-14 | 8 | 4 | 50.0% |
| 05-28 | 210 | 17 | 8.1% |
| 06-09 | 635 | 127 | 20.0% |
| 06-22 | 1,094 | 277 | 25.3% |
| 07-06 | 1,708 | 580 | 34.0% |
| 07-22 | 2,905 | 1269 | 43.7% |
| 08-09 | 4,381 | 2011 | 45.9% |
| 08-30 | 6,100 | 2950 | 48.4% |
| 09-13 | 7,258 | 3510 | 48.4% |
| 09-21 | 7,773 | 3759 | 48.4% |
Historical BDBV reference: ~25% (2007 Uganda Bundibugyo) — ~36% (2012 DRC Isiro). Pooled estimate ~28–33%.
Right-censored: Active outbreak — many cases unresolved. Death proportion will rise further. Deaths in community likely not captured. Do not interpret as final case fatality rate.
Low confidence
Colour: green <25%, amber 25–35%, red ≥36%.
Crude death proportion: --% (right-censored lower bound — active cases unresolved)
Outcomes-adjusted CFR: N/R (recovery data unavailable)
Method: Outcomes-based not computable; crude (right-censored) shown
No recovery count in data sources. Crude 48.0% (95% CI 47–49%) is a right-censored lower bound. Historical BDBV death proportion ~32–36%. Adjust upward as active cases resolve.
Confirmation Rate
100.0%
INSP DRC-only (09-21): 7773 / (7773 + 0) = 100.0% | CDC (09-27) all-source: 7,911 / (7,911 + 116) = 98.6% (cleaned suspected)
Definition: confirmed / (confirmed + suspected). Distinct from test positivity (testing cascade not available). Rate rose from ~6% (05-18) to ~86% (06-11) as PCR backlog cleared and suspected pool was reclassified. Reflects improved diagnostics and mass reclassification, not necessarily fewer true cases. Confidence: low
BDBV-specific RDT
None
Standard Ebola RDTs do not detect BDBV
PCR Machines Deployed
36
Across 19 health zones (INRB-UMIE)
PCR Hub: Bunia
10
28% of all deployed capacity
Confirmation Rate Trend (is the lab system coping?)
| Date | Confirmed | Total | Rate | |
|---|---|---|---|---|
| 05-18 | 33 | 549 | 6.0% | |
| 05-21 | 79 | 824 | 9.6% | |
| 05-24 | 101 | 994 | 10.2% | |
| 05-27 | 119 | 1,025 | 11.6% | |
| 05-28 | 243 | 1,209 | 20.1% | |
| 06-01 (CDC) | 332 | 1,360 | 24.4% | |
| 06-09 (INSP) | 635 | 754 | 84.2% | |
| 06-11 (CDC) | 695 | 811 | 85.7% |
Rate rose from ~6% (05-18) to ~85% (06-11) — reflects PCR backlog clearance and mass reclassification (05-28: 557 suspected reclassified), not necessarily fewer true cases. Denominator differs by source: INSP total (DRC only, confirmed+suspected); CDC total (DRC+Uganda, with cleaned suspected count of 116). Confidence: low
PCR Machine Deployment by Health Zone (INRB-UMIE)
Total: 36 machines across 19 zones. Source: INRB-UMIE testing_capacity dataset. Note: 2 of the 21 affected health zones (Karisimbi, Miti-Murhesa) have no PCR machines listed.
Testing cascade (samples collected/pending/rejected) still not published. PCR machine counts indicate capacity, not throughput. Actual turnaround depends on staffing, reagent supply, sample transport, and security access.
Diagnostic Limitations
- No BDBV-specific RDT exists. Standard Ebola RDTs (SD Bioline, OraQuick) target Zaire ebolavirus GP and do not reliably cross-react with BDBV.
- PCR capacity limited. Only 2 laboratories confirmed for BDBV PCR. Sample transport from remote health zones adds 2-5 days.
- Sequencing turnaround. Pathoplexus releases suggest 2-3 week lag from sample collection to sequence availability.
- Biosafety requirements. BDBV requires BSL-4 for culture. PCR and sequencing can be performed at BSL-3.
Sequences Available (Pathoplexus)
60
16 from 2026 outbreak + 44 historical
2026 Outbreak Genomes
16
DRC: 14, Uganda: 1, Germany: 1 (imported)
Genome Availability (declining)
16/7,911 (0.20%) - CDC 09-27
16/695 confirmed at CDC 06-11 snapshot (2.3%) — 16/7,911 current (0.20%); was ~12% at 125 cases (05-27); genomic surveillance severely behind outbreak growth
Local Analysis Status
34
Historical NCBI GenBank only - update needed
Local analysis uses historical genomes only. 16 outbreak genomes are available on Pathoplexus (accessions PP_006XHL9 through PP_00712Q8) but have not yet been incorporated. Current figure and statistics reflect the 2007/2012 dataset only. Transmission inference is not possible without broader sampling, dates, metadata, and epidemiological links.
Sequence count note: Counts differ by source (Pathoplexus ~54-60 visible, Nextstrain ~45 displayed, local analysis 34). These are overlapping subsets reflecting different snapshots, access levels, and QC filters - not additive totals. Pathoplexus is the primary repository for current outbreak sequences.
2026 Outbreak Sequences (Pathoplexus)
| Accession | Country | Location | Date |
|---|---|---|---|
| PP_006XHL9.1 | DRC | Bunia, Ituri | 2026-05-03 |
| PP_006XHKB.1 | DRC | Bunia, Ituri | 2026-05 |
| PP_006XCJJ.1 | Uganda | Kampala | 2026-05-14 |
| PP_006XXY5.1 | Germany | Imported | 2026-05 |
| PP_006Y8NC.1 | DRC | Katwa, Nord-Kivu | 2026-05-06 |
| PP_006Y8PA.1 | DRC | Hoho, Ituri | 2026-05-03 |
| PP_006Y8Q8.1 | DRC | Lumumba, Ituri | 2026-05-03 |
| + 9 additional DRC sequences (May 2026, Ituri province) | |||
Data use: Pathoplexus "Restricted" licence. Contact Prof. Mbala-Kingebeni (INRB) / Dr. Ssewanyana (CPHL) before publication.
Preliminary Findings (Virological.org / Nextstrain)
- tMRCA: Late February to late April 2026 (rate-dependent). Source: Virological.org rapid communication.
- Distinct clade: 2026 genomes form separate cluster from 2007 Uganda and 2012 DRC lineages. Source: Nextstrain ebola/bdbv.
- ADAR editing: Evidence of host ADAR editing in 1 genome (4 T-to-C mutations).
- Pipeline: RACCOON (MAFFT + IQ-TREE2, HKY+gamma). Not yet reproduced locally.
These findings are from external analyses (Amuri-Aziza and colleagues, Virological.org, May 2026) and have not been independently verified in the local Atlas pipeline.
Phylogenetic Analysis
Four-panel QC assessment of the local 34-genome NCBI GenBank dataset. Includes geographic distribution, temporal coverage, sequence length QC, and genetic distance QC.
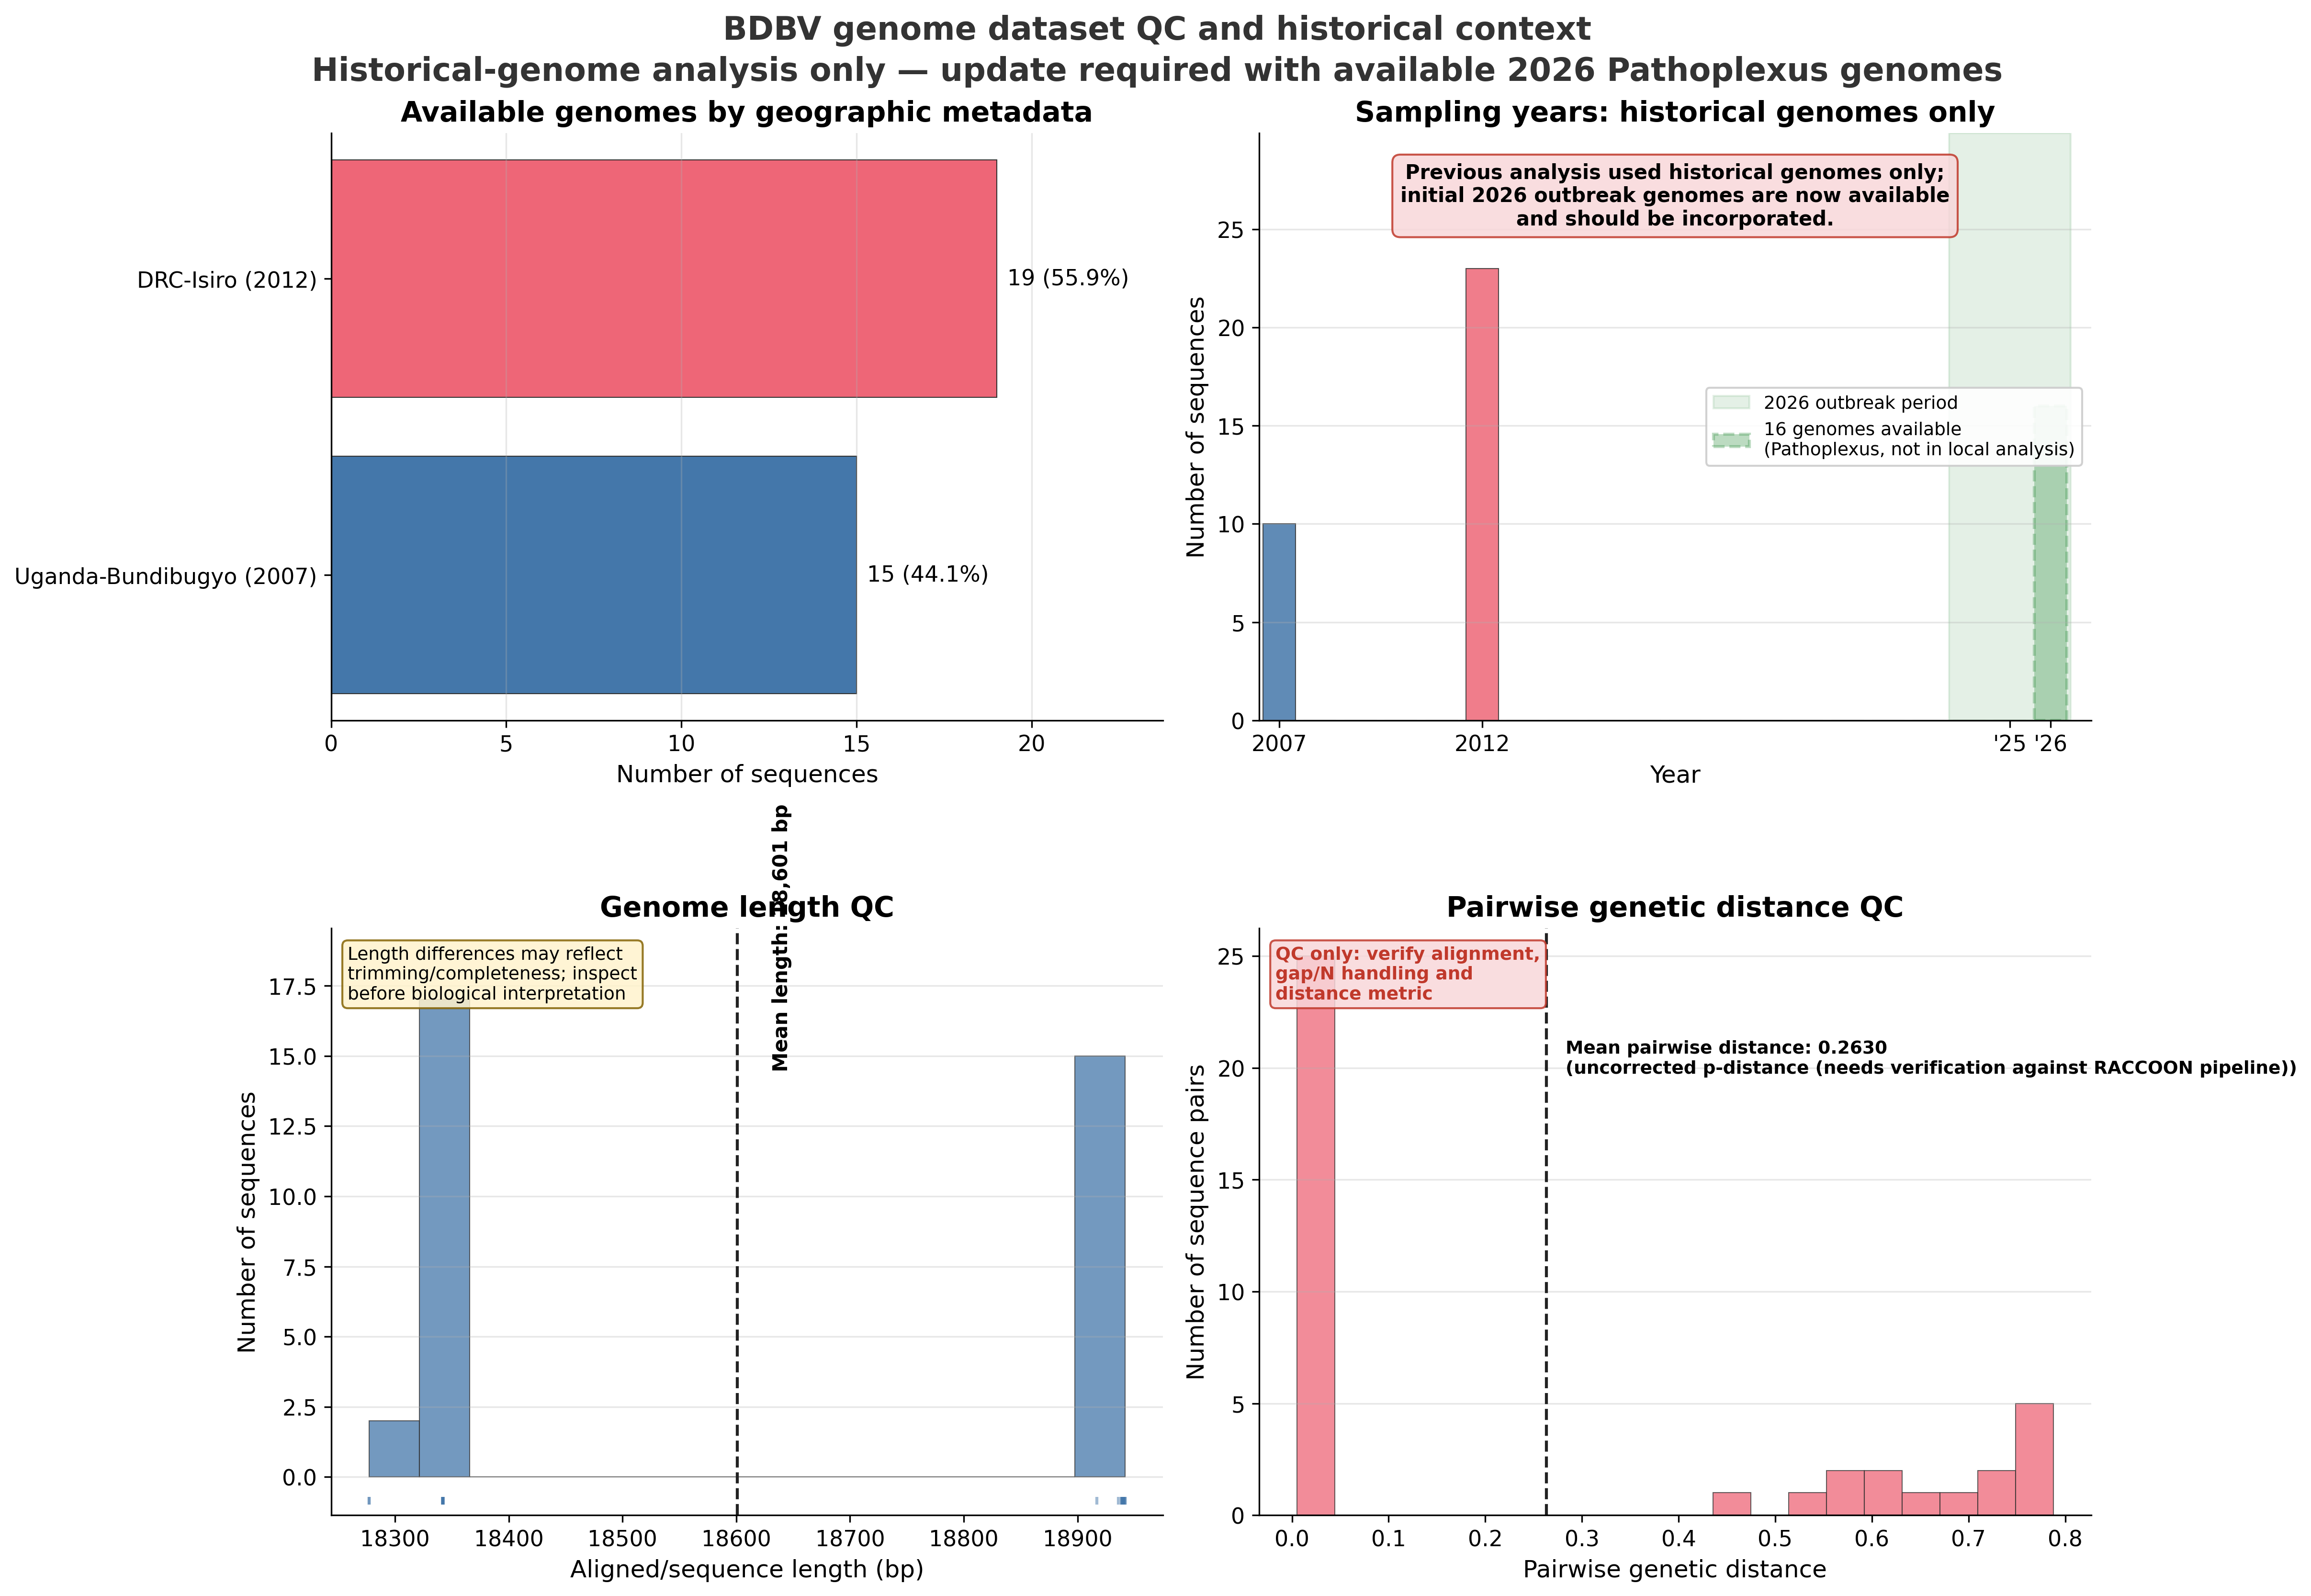
Local dataset: 34 NCBI GenBank sequences (2007 Uganda, 2012 DRC-Isiro). 16 Pathoplexus 2026 sequences not yet incorporated. This figure is QC only and must not be interpreted as evidence for current transmission patterns.
Nextstrain view: Live ML phylogeny maintained by nextstrain.org, combining historical and 2026 outbreak genomes from GenBank and Pathoplexus (including Restricted Use sequences). Requires internet connection. The local QC tab shows the Atlas-internal historical dataset assessment (offline-capable). Nextstrain is a cross-check source, not the sole primary data source.
Sequencing Coverage and Bias Assessment
Sequencing bias: Coverage concentrated in Ituri (INRB Bunia lab). Nord-Kivu and Sud-Kivu severely underrepresented. Temporal bias: all sequences from first 2 weeks of May 2026. Later transmission phases unsampled.
Sequencing Turnaround: Collection to Pathoplexus Release
Median
15d
Collection to release
Range
4-18d
Fastest (Uganda) to slowest
Mean
13.6d
Across 16 sequences
Turnaround measured from sample collection date to earliest Pathoplexus release date. Uganda sample (4 days) significantly faster than DRC median (15 days), likely reflecting lab proximity and sample transport logistics. For genomic data to inform real-time response, target is <7 days. Source: Pathoplexus metadata via Virological.org.
Contact tracing data now available from INSP SitRep via INRB-UMIE GitHub. Daily cumulative totals for contacts traced and isolated. Individual follow-up rates and secondary case attribution not available from this source.
Contact Tracing Summary — Africa CDC Sitrep Africa CDC Sitrep #24, June 10 2026
17,693
Contacts listed
16,862 DRC · 831 Uganda
14,782
Under follow-up
13,951 DRC · 831 Uganda
83.5%
Follow-up coverage
WHO target >80% Meets WHO target
Follow-up coverage rate
0%WHO target 80%100%
Source: Africa CDC Sitrep #85, August 10 2026. Coverage = contacts under active follow-up / contacts listed. New contacts/day (DRC): --. Integrity: Africa CDC official sitrep, PDF-extracted, auto-verified.
Contact Tracing Cascade (INSP data)
| Date | Cum. Traced | Cum. Isolated | Notes |
|---|---|---|---|
| 05-14 | 82 | ND | |
| 05-15 | ND | ND | Source literally "ND" for all zones |
| 05-18 | 541 | 79 | |
| 05-19 | 847 | 114 | |
| 05-20 | 1,261 | 181 | |
| 05-21 | 1,427 | 244 | |
| 05-22 | 1,674 | 318 | |
| 05-23 | 1,817 | 302 | Isolated dropped (reclassification?) |
| 05-24 | 2,231 | ND | Isolated ND at source for multiple zones |
| 05-27 | 2,635 | ND | |
| 05-28 | ND | ND | Source returns 0 (treated as ND) |
| 05-29 | 3,550 | ND | |
| 05-30 | 3,550 | ND | No change from 05-29 |
| INRB-UMIE per-zone data ends 05-30. Below: Africa CDC Sitrep (DRC+Uganda, "listed" not "traced"). | |||
| 06-10 (Africa CDC #24) | 6,525 listed | 4,930 monitored | Coverage 75.5% — below WHO 80% target |
INRB-UMIE rows: INSP SitRep MVE 001-025 (DRC only, through 05-30). Africa CDC row: Sitrep #24 (DRC+Uganda, June 10 2026). "ND" = not declared at source. Metric differs: INRB-UMIE reports cumulative contacts traced/isolated; Africa CDC reports contacts listed and under active follow-up — not directly comparable. Contacts-to-case ratio (05-27, DRC-only): ~11:1 (2,635 traced / 243 confirmed). Follow-up completion rates not available from INRB-UMIE (cumulative totals only).
Transmission Indicators
- Unknown-source cases: Proportion not reported. Critical indicator for hidden transmission chains.
- Nosocomial transmission: Index case was HCW; healthcare facility transmission documented but not quantified.
- Household clusters: Reported but not enumerated. Linelist data required.
- Cross-border contacts: DRC-Uganda joint tracing active. 6 of 11 Uganda confirmed cases linked to DRC travel. 436 contacts identified in Uganda (WHO DON605).
- Rt estimate: Not published. WHO/ECDC note incidence exceeds expected secondary infections. Modelling groups have not yet published estimates.
Vaccination
- No approved BDBV vaccine. rVSV-ZEBOV (Ervebo) targets Zaire ebolavirus; cross-protection not established.
- Candidate evaluation: WHO expert consultation 2026-05-28. Multiple candidates under review.
- Timeline: Africa CDC estimates BDBV-specific vaccine by end of 2026.
Therapeutics
- No approved BDBV therapeutic.
- Candidates: MBP134 (broad-spectrum mAb), Maftivimab, Remdesivir (investigational).
- Supportive care: Primary treatment approach. IV fluids, electrolyte management, symptom control.
IPC / Case Management
- IPC active in major health facilities in affected zones.
- ETU capacity: loading…
- Conflict limitation: Armed groups restrict access to multiple health zones.
ETU Bed Occupancy — Africa CDC Sitrep #81, August 6 2026
58.6%
Ituri ETU occupancy
N/R
National ETU occupancy (DRC)
721
Patients in isolation
Confirmed + suspected
Ituri ETU occupancy rate
0%
Surge threshold 90%
100%
Africa CDC Sitrep #81, August 6 2026 (server-side fallback; JS updates at runtime)
Response Actions and Progress
| Action | Timeline | Responsibility | Status |
|---|---|---|---|
| Incorporate Pathoplexus genomes into local analysis | Immediate | Atlas pipeline | Pending |
| Enhanced border surveillance (50km radius) | 0-7 days | DRC-Uganda joint | In progress |
| Deploy BDBV-specific PCR to Nord-Kivu | 1-2 weeks | WHO, Africa CDC | Planned |
| BDBV vaccine candidate trial initiation | 4-8 weeks | WHO R&D Blueprint | Under review |
| Community engagement in Ituri IDP camps | Ongoing | MSF, UNICEF | Active |
| Lab capacity: sample-to-result <48h target | 2-4 weeks | INRB, WHO | Gap |
Community Intelligence & Social Trust
- Community trust (Ituri/Nord-Kivu): Not formally assessed since outbreak declaration. Ituri has prior BDBV exposure from 2007; community memory is mixed. IDP camp settings in Bunia and Komanda carry elevated mistrust risk based on Kivu 2018–2020 patterns. No current WHO EIOS signal integrated. Not assessed — manual update required
- Rumour monitoring: WHO EIOS and HealthMap not queried in this pipeline. Virological.org commentary (May 2026) noted community hesitancy reports in Mongbalu and Rwampara. No structured social listening active. In Kivu 2018–2020, unmonitored rumours delayed ETU acceptance by 2–4 weeks in multiple zones. Not monitored
- Safe burial compliance: Not reported in public sitreps. In Kivu 2018–2020, unsafe burials were implicated in ~30% of documented transmission chains. No denominator (safe burials conducted / confirmed deaths) available from current sources. Critical gap for outbreak control assessment.
- Armed group access restrictions: Documented in Ituri and Nord-Kivu — restricts contact tracing, ETU operations, and safe burial teams. Cases in conflict-affected zones are likely systematically underrepresented. Source: OCHA/MSF field reports (not automated in this pipeline).
Data gap — manual update required. Community intelligence is not sourced automatically. This section requires manual update from WHO EIOS, MSF/UNICEF field reports, and community feedback channels. Lesson from Kivu 2018–2020: community resistance was a primary outbreak prolongation factor yet was systematically underweighted in early surveillance dashboards. Low confidence
Coordination Structure
| Level | Lead | Key Activities |
|---|---|---|
| International | WHO (Grade 3), GOARN | PHEIC coordination, R&D Blueprint, technical guidance |
| Regional | Africa CDC | Regional surveillance, vaccine development coordination |
| National (DRC) | MoH / INRB | Outbreak response, laboratory confirmation, genomic surveillance |
| National (Uganda) | MoH / CPHL | Border surveillance, case management, contact tracing |
| Field | MSF, UNICEF, WHO CO | ETU operations, community engagement, IPC training |
Confidence levels (Atlas taxonomy):
high ≥2 independent sources, consistent, no major data gaps;
moderate single primary source or minor inconsistencies;
low indirect estimate, proxy data, or significant gaps.
⚓ definition
Data Completeness by Category (updated with INRB-UMIE data)
Case counts (daily)85%
Case classification60%
Geographic (health zone)90%
Population denominators100%
Attack rates90%
Testing capacity (PCR)80%
Contact tracing (cum.)50%
Lab confirmation rate86%
Genomic availability~2%
Demographics5%
Testing cascade10%
Geographic (village/GPS)0%
Completeness improved significantly with INRB-UMIE data integration (health zone level daily reporting, WorldPop denominators, PCR deployment). Remaining critical gaps: individual-level demographics, testing throughput cascade, village-level geographic precision.
Known Data Biases
- Surveillance bias: Conflict zones in Ituri underreported. True case count likely higher than reported.
- Reclassification (ongoing): DRC MoH removed ruled-out cases from suspected total; peak suspected ~1,077 (26 May) fell to ~206 (DRC MoH, 30 May) and 116 after CDC data revision (03 June). INRB-UMIE currently reports ongoing suspected caseload. Reclassification continues as case investigations close.
- Diagnostic progress: Confirmed cases grew rapidly May–June 2026 as PCR backlog cleared and suspected cases were reclassified. Confirmation rate rose from ~6% (05-18) to current levels; see Lab tab for trend.
- Reporting delay: Estimated 3-7 days from onset to notification. Recent weeks may be underestimated (right-truncation).
- Sequencing coverage declining: Was ~12% at 125 cases (05-27), now 0.20% at 7,911 cases (09-27). Same 16 genomes, outbreak outpacing sequencing. Concentrated in Ituri/early May. Not representative of current outbreak diversity.
- Denominator uncertainty: Population estimates from WorldPop. Conflict displacement makes denominators unreliable.
Data Source Status
| Source | Last Access | Data Type | Status |
|---|---|---|---|
| INRB-UMIE GitHub | INRB-UMIE: 2026-09-21 | Daily cases, contacts, hospitalisation, PCR, population, travel time | Active |
| Africa CDC Sitrep | Africa CDC Sitrep: 2026-08-01 | Contacts listed/monitored, HCW cases, health zones (DRC+Uganda) | Active |
| CDC (DRC / Uganda) | CDC DRC: · Uganda: | Confirmed case counts by country | Active |
| WHO DON602/603/605 | 2026-05-29 | National case counts, risk assessment | Not re-checked since 05-29 |
| ECDC TAB | 2026-05-29 | EU/EEA risk, preparedness | Not re-checked since 05-29 |
| Pathoplexus | 2026-05-30 | BDBV genome sequences | Not re-checked since 05-30 |
| Virological.org | 2026-05-30 | Phylogenetic interpretation | |
| WorldPop (via INRB-UMIE) | 2026-05-30 | Population denominators (519 zones) | |
| DRC MoH linelist | -- | Individual case records | Not accessible |
| Contact tracing detail | -- | Individual follow-up, outcomes | Cumulative totals only |
| Dashboard render | Rendered: 2026-09-27 | Server-side HTML generation | Auto (3h) |
Oldest primary source: 2026-08-01
Data Access Requirements
| Module | Data Needed | Source System | Status |
|---|---|---|---|
| B. Cases / E. Person | Individual case linelist (onset, age, sex, outcome) | DRC MoH / INSP / DHIS2 | DSA required |
| C. Time (onset curve) | Individual onset dates | Derived from linelist | Blocked by linelist |
| F. Lab (cascade) | Sample cascade: collected/tested/pending/rejected | INRB LIMS | Not accessible |
| H. Contacts (detail) | Follow-up rates, transmission chains | WHO Go.Data / MSF | Operational data |
| I. Response (ops) | Team deployment, IPC, WASH, safe burials | MSF / WHO / UNICEF | Multiple sources |
| G. Genomics (linked) | Sequence-to-case linkage | INRB + MoH coordination | Cross-system |
Full data access requirements: DATA_ACCESS_REQUIREMENTS.md. When data files are placed in
data/incoming/, the ingestion pipeline auto-processes them into the dashboard.Privacy and Governance
- Case data: All data from aggregate public reports. No individual-level data in this dashboard.
- Genomic data: Pathoplexus "Restricted" licence. Contact lead investigators before publication use.
- Map data: Case locations at health zone centroid level (not individual GPS). No geomasking needed at current precision.
- Dashboard access: Self-contained HTML file. No data transmitted to external services. Offline-capable.
About this tab
Reported case counts are a lower bound on true outbreak size. Incomplete case ascertainment, mild illness, remote geography, and reporting delays systematically suppress detected counts. This tab presents model-based estimates derived from confirmed deaths and observed growth rate, following the back-calculation methodology of McCabe et al. (2026, Lancet Infectious Diseases) — an Imperial College London / WHO collaboration. All figures carry wide uncertainty and are recomputed automatically from live data on every page load. These are situational awareness tools, not operational targets.
Reported case counts are a lower bound on true outbreak size. Incomplete case ascertainment, mild illness, remote geography, and reporting delays systematically suppress detected counts. This tab presents model-based estimates derived from confirmed deaths and observed growth rate, following the back-calculation methodology of McCabe et al. (2026, Lancet Infectious Diseases) — an Imperial College London / WHO collaboration. All figures carry wide uncertainty and are recomputed automatically from live data on every page load. These are situational awareness tools, not operational targets.
Reported Confirmed Cases
--
Loading...
Estimated True Cases (Bayesian posterior median)
--
Loading...
Estimated Detection Rate
--
Loading...
Instantaneous Rt — Cori method, 7-day window
--
Loading...
Instantaneous reproduction number (Cori et al. 2013). 7-day sliding window on INRB-UMIE upstream national confirmed incidence (Python-computed). Serial interval: Gamma(mean=11.4d, SD=5.0d) — BDBV DRC 2007 outbreak (MacNeil et al. 2010). Burn-in 18 days; min infectivity guard. 18-day burn-in applied. Notification-date only. Right-truncated: last ~12 days underestimated. Confidence: moderate.
Parameter Sensitivity: CFR × Doubling Time
| CFR 26% (low) | CFR 33% (main) | CFR 40% (high) | CFR 20.2% (empirical) | |
|---|---|---|---|---|
| DT 7d fast | -- | -- | -- | -- |
| DT 10d main | -- | -- | -- | -- |
| DT 14d slow | -- | -- | -- | -- |
Each cell: estimated true cases (detection%). Highlighted = main scenario (DT 10d, CFR 33%). Red column = observed 28-day death proportion.
CFR: 33% (95% CI 26–40%), onset-to-death mean 11.4 days. Source: McCabe et al. 2026, Lancet ID. All cells recompute from live confirmed deaths on every page load.
Observed Doubling Time (rolling 14-day)
Observed DT
7d threshold
10d threshold
14d threshold
DT = 14 × ln(2) / ln(C_t / C_{t−14}) from INRB-UMIE confirmed cases. Suppressed where denominator <20. Red shading: last 10 days (provisional).
Shadow Epidemic: Reported vs Estimated True Cases
Reported (confirmed)
Bayesian median
95% Credible Interval
Bayesian back-calculation (2,000 MC samples) using MGF-corrected onset-to-death Gamma distribution. Band = 95% CrI across CFR ~ Beta(57,117) and DT ~ LogNormal. Red-shaded right: last 10 days provisional. Estimated infections occurred ~11 days before their corresponding deaths.
Posterior Distribution — Estimated True Cases (current)
Posterior median
95% CrI
Reported (confirmed)
Posterior distribution over estimated true cases at most recent data point. 2,000 Monte Carlo samples. CFR sampled from Beta(57,117), DT from LogNormal(median=10d). MGF-based correction for Gamma onset-to-death distribution.
Instantaneous Reproduction Number Rt (Cori et al. 2013)
Rt posterior median
95% Credible Interval
Rt = 1 threshold
Reclassification window (excluded)
Nowcast (delay-adjusted) — indicative only
Cori instantaneous Rt with 7-day sliding window. Serial interval: Gamma(mean=11.4d, SD=5.0d) — BDBV DRC 2007 outbreak (MacNeil et al. 2010); replaces previous ZEBOV proxy (12d). Source: INRB-UMIE/BDBV2026-Data upstream pipeline (Python-computed, authoritative). 18-day burn-in applied; infectivity floor guard prevents early-outbreak Rt explosion. Notification date only — onset-based incidence not available. Right-shaded: last ~12 days right-truncated (reporting delay ~9d). loading…
Nowcast band applies a multiplicative reporting-delay correction (mean delay 9d, log-normal, σ=0.6) to the right-truncated tail. Uncertainty is underestimated — treat as indicative only.
Why are two Rt values shown?
The dashboard presents Rt from two independent methods. The difference is intentional — they use different inputs and serial interval (SI) assumptions suited to different purposes.
| Method | Estimate | Serial interval | Input data | Use for |
|---|---|---|---|---|
| Cori et al. 2013 | -- | Gamma(11.4d, SD 5d) — BDBV DRC 2007 (MacNeil 2010) | INRB-UMIE upstream national series, 7-day window, 18d burn-in | Transmission surveillance |
| Lotka–Euler | -- | Gamma(15.4d, SD 5d) — pooled Ebola review | Smoothed rolling 14-day doubling time | Scenario planning input |
The Cori estimate now uses the BDBV-specific SI (11.4d) replacing the previous ZEBOV proxy (12d). Remaining divergence from Lotka–Euler arises from the longer SI assumption (15.4d pooled Ebola) and the use of smoothed rolling DT rather than corrected incidence. For interpreting transmission trends, use the Cori estimate. For scenario planning, the Lotka–Euler input is appropriate with the 7d DT floor.
McCabe et al. (2026, Lancet ID) — Prospective Assessment (Day ~27)
Independent Assessment
McCabe et al. published on 2026-05-27 (day ~12, n=125 confirmed). Their Method 1 (back-calculation from deaths) gave ~88–140 true cases; Method 2 (geographic spread model) gave 945 (95% CI 196–2,274) — a 9× internal discrepancy. After 50 days (n=689 confirmed, 139 deaths) we can assess which estimate better reflected outbreak size. Two shadow trajectories below use McCabe’s 33% CFR prior vs the observed 50-day death proportion (20.1%).
| Parameter | McCabe et al. (day 12) | This study (day ~27) |
|---|---|---|
| Case fatality rate | 33% (historical prior) | -- |
| Laboratory ascertainment | Not estimated | 3% (day 1) → 80% (day 28) |
| Rt (Cori, last non-provisional) | Not estimated | -- |
| Estimated true epidemic size | 88–140 (M1) · 945 (M2) | -- |
Death proportion trajectory
Confirmed deaths / confirmed cases (%) — why the empirical CFR differs from McCabe's 33% prior
Observed confirmed
Shadow (CFR 33% — McCabe prior)
Shadow (observed death proportion — 20.2%)
McCabe M2 at 05-27 (945; CI 196–2,274)
| Metric | At 05-27 (McCabe pub.) | At 06-11 (day ~50) |
|---|---|---|
| Observed confirmed | 125 | 689 |
| Observed deaths | 17 | 139 |
| Death proportion (observed) | 13.6% (right-censored) | -- |
| McCabe M2 shadow (geographic) | 945 (196–2,274) | Not projected |
| Our shadow (CFR 33%, DT 10d) | -- | -- |
| Our shadow (DP 20%, DT 10d) | n/a † | -- |
| Implied detection (CFR 33%) | -- | -- |
| Implied detection (DP 20%) | -- | -- |
† Observed death proportion at 05-27 (13.6%) is right-censored and unreliable as a CFR proxy at day 12; 20% is the 50-day observed figure applied retrospectively for comparison only.
Back-calculation from confirmed deaths (Method 1). DT=10d; MGF-corrected Gamma onset-to-death (mean 11.37d, SD 5.41d).
Right-censoring direction: The observed death proportion of ~20.2% understates the true CFR — active cases have not yet resolved. Using it in back-calculation overestimates shadow size: the 1,423-case estimate is an upper-range scenario under current surveillance conditions. As the outbreak resolves and CFR rises toward the historical 33%, shadow estimates will decrease. Both estimates bracket the likely true range.
Right-truncation also suppresses early estimates (deaths not yet accrued). McCabe M2 geographic model not reproduced here (requires travel volume data). Low confidence. For research purposes only.
Methodology, Parameters & Limitations
Cited Parameters (constants)
| Parameter | Value | Source |
|---|---|---|
| Case fatality rate (CFR) | 33% (95% CI 26–40%) | McCabe et al. 2026, Lancet ID |
| Onset-to-death mean | 11.37 days (SD 5.41) | McCabe et al. 2026 |
| Growth correction | exp(r × mean_delay) | Standard back-calculation |
| Doubling time scenarios | 7, 10, 14 days | McCabe et al. 2026 |
| Serial interval (Rt model) | Gamma(mean=11.4d, SD=5.0d) — BDBV-specific, MacNeil et al. 2010 (DRC 2007 outbreak) | MacNeil et al. 2010; replaces earlier ZEBOV proxy (12d). Same value used in all Rt computations. |
| Rt window | 7-day sliding; Gamma conjugate posterior (a=1, b=5 prior) | Cori et al. 2013, AJE |
| K (uncontrolled ceiling) | 25,000 [range 15,000–40,000] | Calibrated to CDC MMWR mm7522e1; range reflects uncertainty in final outbreak size |
| K (partial control) | 5,000 [range 3,000–8,000] | CDC MMWR mm7522e1 partial-containment projection; range estimated |
Formula
E = D ÷ CFR × exp(r × mean_delay)
where r = ln(2) ÷ DT, D = confirmed deaths (live), DT = doubling time scenario
where r = ln(2) ÷ DT, D = confirmed deaths (live), DT = doubling time scenario
Assumptions
- CFR is constant over time and across age/treatment groups
- Confirmed deaths are a complete or near-complete record
- Epidemic growth is approximately exponential during the observation window
- Uganda cases excluded from DRC back-calculation denominator
Limitations
- Does not account for heterogeneous transmission by zone or conflict-related underreporting
- Recent death counts are right-truncated: onset-to-death delay means deaths from the last 2 weeks are not yet fully accrued
- Method 2 (geographic spread model) not recomputed here — requires travel volume data not in this pipeline. McCabe et al. estimate: 945 cases (95% CI 196–2,274) as of 2026-05-27
Evidence level: Model-based estimate, low–moderate certainty. Wide uncertainty bounds reflect genuine parameter uncertainty.
Citation: McCabe R, et al. Estimating the true size of the 2026 Bundibugyo ebolavirus disease outbreak. Lancet Infectious Diseases, 2026. Imperial College London / WHO collaboration.
Citation: McCabe R, et al. Estimating the true size of the 2026 Bundibugyo ebolavirus disease outbreak. Lancet Infectious Diseases, 2026. Imperial College London / WHO collaboration.
Scenario Explorer
Hypothetical Scenarios — Not ForecastsImportant: These projections show what would happen IF transmission stays at the selected Rt value from today. They are NOT predictions. Interventions take weeks to implement and show effect. Uncertainty bands widen rapidly — beyond 4–6 weeks only the direction of travel (growing / stable / declining) is informative. Use for planning illustration only.
Current Transmission Dynamics
| Parameter | Value | Source / Note |
|---|---|---|
| Observed doubling time | -- | Rolling 14-day (INRB-UMIE) |
| Estimated Rt (doubling-time) | -- | Lotka-Euler, Gamma SI (DT-based) |
| Estimated Rt (Cori method) | -- | 7-day window posterior; INRB-UMIE upstream |
| Serial interval | 11.4d SD 5.0d (BDBV) / 15.4d pooled Ebola | MacNeil 2010 (BDBV); pooled Ebola systematic review |
| Rt data quality | Moderate | Batch reporting inflates DT variance |
Rt derived from observed rolling doubling time using Lotka-Euler equation with Gamma-distributed serial interval. Batch reporting in INRB-UMIE (zero-then-batch pattern) inflates variance. Estimate smoothed over last 3 valid DT values.
Projected Case Counts — 30 / 60 / 90 days
| Scenario | Rt | 30d | 60d | 90d † |
|---|---|---|---|---|
| Uncontrolled | -- | 4,882 | 3,013 | 1,860 |
| Partial (Rt 1.5) | 1.5 | 5,982 | 5,395 | 5,169 |
| Controlled (Rt 1.0) | 1.0 | 7,911 | 7,911 | 7,911 |
| Suppressed (Rt 0.7) | 0.7 | 4,000 | 2,023 | 1,023 |
Logistic growth model (Chowell et al. 2016). Uncontrolled ceiling K=25,000; partial K=5,000 — calibrated to CDC MMWR mm7522e1 worst-case projections. † Beyond 8-week validity horizon (Chowell 2017). Format: median [90% CI].
K sensitivity — 30-day uncontrolled scenario, Rt = --:
K=15,000 → 4,882 cases · K=25,000 → 4,882 cases (current assumption) · K=40,000 → 4,882 cases
K = epidemic ceiling (logistic model). Calibrated to K=25,000 from CDC MMWR mm7522e1; range reflects uncertainty in final outbreak size.
K=15,000 → 4,882 cases · K=25,000 → 4,882 cases (current assumption) · K=40,000 → 4,882 cases
K = epidemic ceiling (logistic model). Calibrated to K=25,000 from CDC MMWR mm7522e1; range reflects uncertainty in final outbreak size.
Epidemic Trajectory — 12-Week Scenarios (logistic model, from reported confirmed)
Historical confirmed (reported)
Uncontrolled (current Rt)
Partial containment (Rt 1.5)
Controlled (Rt 1.0)
Suppressed (Rt 0.7)
Logistic growth model; resurgence ceiling K=50,000, partial-containment K=20,000 (updated from original K=5,000 which was below current N₀=5,815). When current Rt<1, worst-case scenario uses Rt=2.0 (hypothetical resurgence); green line shows current observed trend. Orange dashed line = 8-week validity horizon (Chowell et al. 2017). Shaded bands: ±20% on N₀, ±15% on growth rate. These are scenarios, not forecasts.